Data Visualization: Google Data Studio v/s Power BI v/s Tableau

FEATURES & REPORT TYPES
The types of reports and dashboards that can be built vary widely between Google Data Studio and Power BI or Tableau. The capabilities are most similar between Tableau and Power BI.
FUNCTIONS:
Data Analysis Expressions (DAX) in Power BI are expressions or formulas used for data analysis and calculations while Tableau has its own set of functions for different needs. Please refer to the listed function section for more. Google Data Studio also has a modest list of functions. Though not nearly as extensive as Power BI or Tableau. Purely from this perspective, these applications rank from most to least functions is Power BI, Tableau, then Google Data Studio.
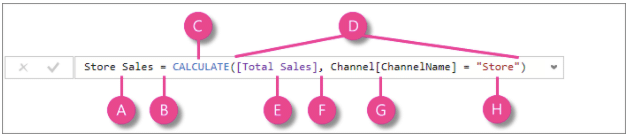
Pic: DAX, PowerBI
VISUALIZATIONS:
From the perspective of visualizations, Tableau still has a slight edge over Power BI. Tableau has a large variety of visuals, that function as visualization design using artificial intelligence. This makes for beautiful and appropriate visualizations for most of the dimensions and measures you are working with, although Power BI is quickly catching up in this respect. But if you have simple data that you want to make sense of without the need for aesthetics, Google Data Studio may be best for you.
Pic: Tableau Visualization - City and Colour
DATA SOURCES:
Both Power BI and Tableau provide access to a wide range of data sources. But at the time of writing this article, Tableau narrowly edges out Power BI in this respect. In Google Data Studio you will often see yourself spending money on third party connectors to facilitate connections to unpopular data sources.
ETL (Extract, Transform and Load):
In terms of ETL, Power BI has extensive support in the form of Power Query and Power BI Data Flows. The connection to analysis services also allows for the creation of cubes. Tableau prep does some of these functionalities well, but if you want visualizations for your data warehouse or data mart, then you would be better off choosing Power BI. Google Data Studio has little to nothing to offer by way of ETL. If your data is dirty and complex, you would do well to stay away from Google Data Studio.
Pic: PowerBI Data Flow
ARTIFICIAL INTELLIGENCE:
‘Ask Data’ in Tableau uses natural language processing to ask questions about data visualization. Similarly, Power BI’s ‘Q&A’ provides the ability to type natural language questions about your data and get responses in the form of visualizations. This feature is available in both Power BI Desktop and service, although both these functionalities leave much to be desired. Tableau’s Explain Data and Power BI Insights help interpret sudden fluctuations in data and explain how and why something happened. This allows you to make more sense of your data.
AVAILABILITY
The availability of these platforms varies widely by price and variation of product. Google Data Studio is only available in the Web format and can be accessed through a browser. On the other hand, Tableau and Power BI both have desktop, mobile, and web versions. The web versions on all three platforms are backed up on cloud while the desktop versions of Power BI and Tableau can be stored on your local machine and on-premises servers.
Pic: PowerBI Tablet
COST
The price range of the products also differs by version type and your requirements. Where Google Data Studio is basically free, Power BI and Tableau have different prices for different versions. For Power BI, the enterprise version costs approximately $5,000/month while the self service pro version is only $10/month. The cost for Tableau can range from $12 to $70 per user per month for both individuals and enterprise variations. This means that for large organizations the bill can rack up quickly.
Pic: Tableau Pricing
EASE OF -- USE
The ease of use is the most subjective factor in this comparison. Google Data Studio works best with Google Analytics, Google AdWords, DoubleClick and other Ad platforms. In a similar manner, Power BI works best with other Microsoft technologies like Azure, Sharepoint, SQL Server, PowerApps and the whole gamut of Microsoft Applications. Tableau is more of a general purpose BI tool and can work well with most applications. However, if the developers are using Mac systems, then Tableau may be the only available option for desktop visualization tools as Power BI does not have a desktop application for Apple Computers.
Pic: Azure with PowerBI
LIST OF FUNCTIONS
Below are links to the list of functions in all three of the data visualization tools for a more extensive comparison in terms of manipulating data and getting the most out of your Business Intelligence:
Google Data Studio
Power BI
Tableau
For more news on the latest digital innovations, follow us on Instagram @zora.digital. Need help setting-up your own data visualization dashboard Contact Us. Data is power. Our analytical talents fuel our pragmatic approach, ensuring that data is properly understood and used to drive business decisions.
Zora Digital is a Chicago digital marketing agency. We provide digital strategy consulting for purpose-led brands —strategy, implementation, analytics, and optimization.
Do you want to learn more about data visualization? Fill out the form below and let us know!